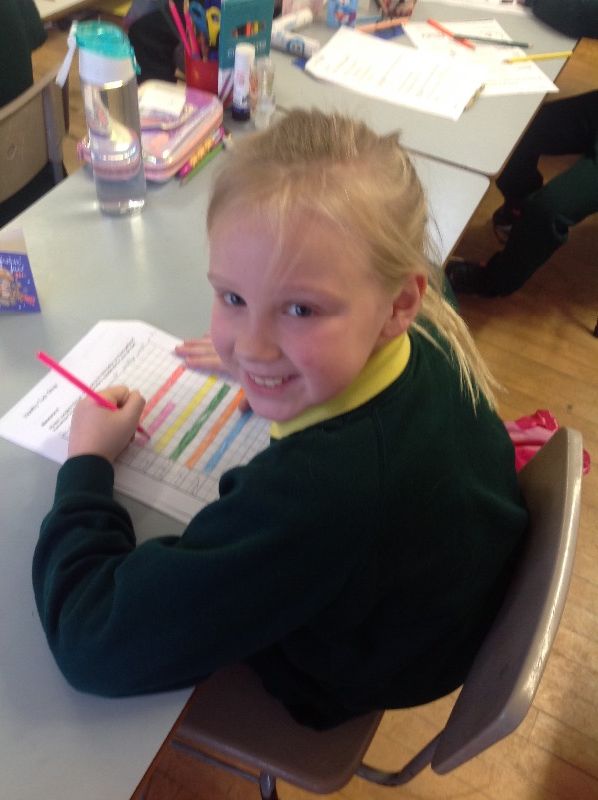
As part of our Handling Data Week, P.5 explored tally charts and bar graphs. We took a survey to find out our favourite healthy snacks. We then recorded our findings as a tally chart and represented the information in bar graphs.